Projects
Land Ownership and Boundary Change Detection
Tools: Python (arcpy) · ArcGIS Pro · Relational Database · ReGrid · Data Harmonization
Outcomes:
- 93% reduction in per-state-per-month QA review effort (from ~2 analyst-weeks down to under a day, on the recurring monthly Regrid refresh that drives the pipeline)
- Enabled analysis and outreach at the parent-company level rather than the shell LLC level
- Produced a versioned, longitudinal record of ownership and parcel geometry changes across the Southeast U.S.
Core Objective: Systematically monitor tax parcel data to detect ownership changes and boundary modifications, including partial sell-offs. These changes serve as indicators of areas of strategic interest for acquisitions, conservation planning, and market analysis.
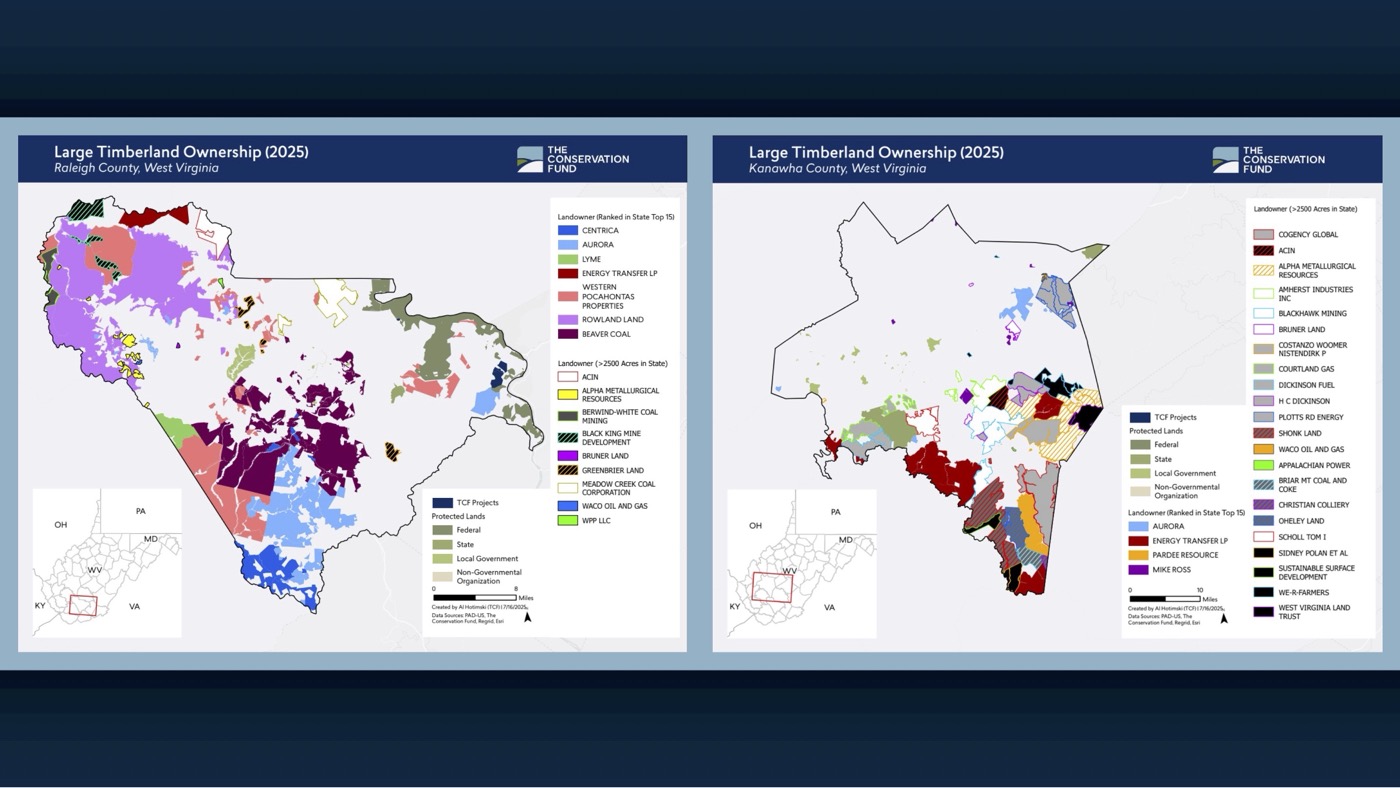
Context: The timberland industry relies heavily on multi-tiered LLC structures, making it difficult to identify who actually controls large contiguous forest blocks. This system was built to cut through that complexity and detect the ownership and land fragmentation trends that matter most to conservation: who is acquiring land, who is selling it off in pieces, and how fast the landscape is changing. Configured to run on an automated, recurring basis and currently focused on the Southeast U.S., where timber harvesting pressures and forest loss are most acute. The pipeline is state-scoped by design and can be run against any geography where ReGrid data is available.
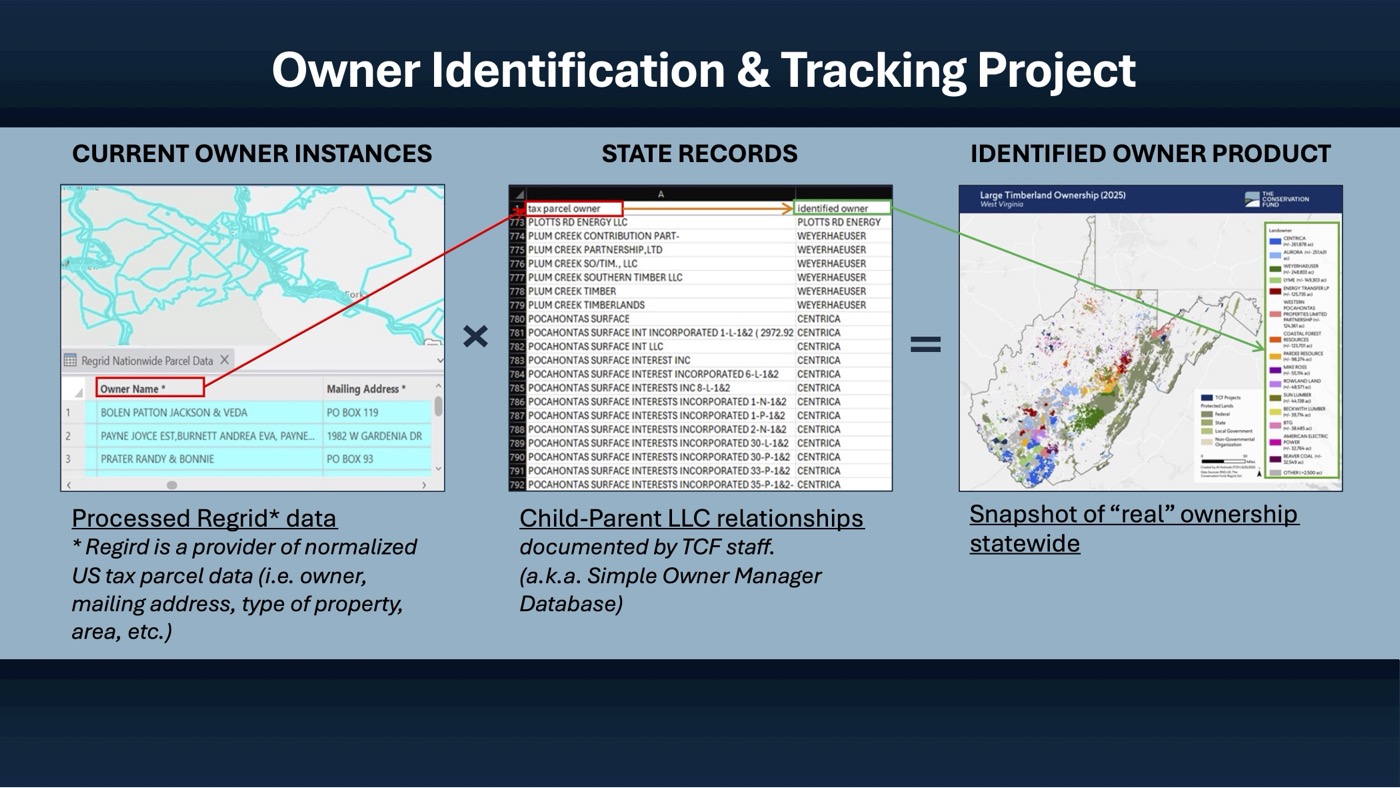
Problem: Tax parcel ownership records are filed inconsistently across counties: the same company appears under dozens of name variants (e.g., “Company IIX”, “Conpany IX”), and multi-tiered LLC structures obscure the true controlling entity. Manually resolving these records and detecting meaningful changes between snapshots was slow and error-prone at scale.
What I Built:
A structured geodatabase pipeline that processes raw parcel data (ReGrid) into a clean, time-stamped ownership intelligence layer. The system works in three stages:
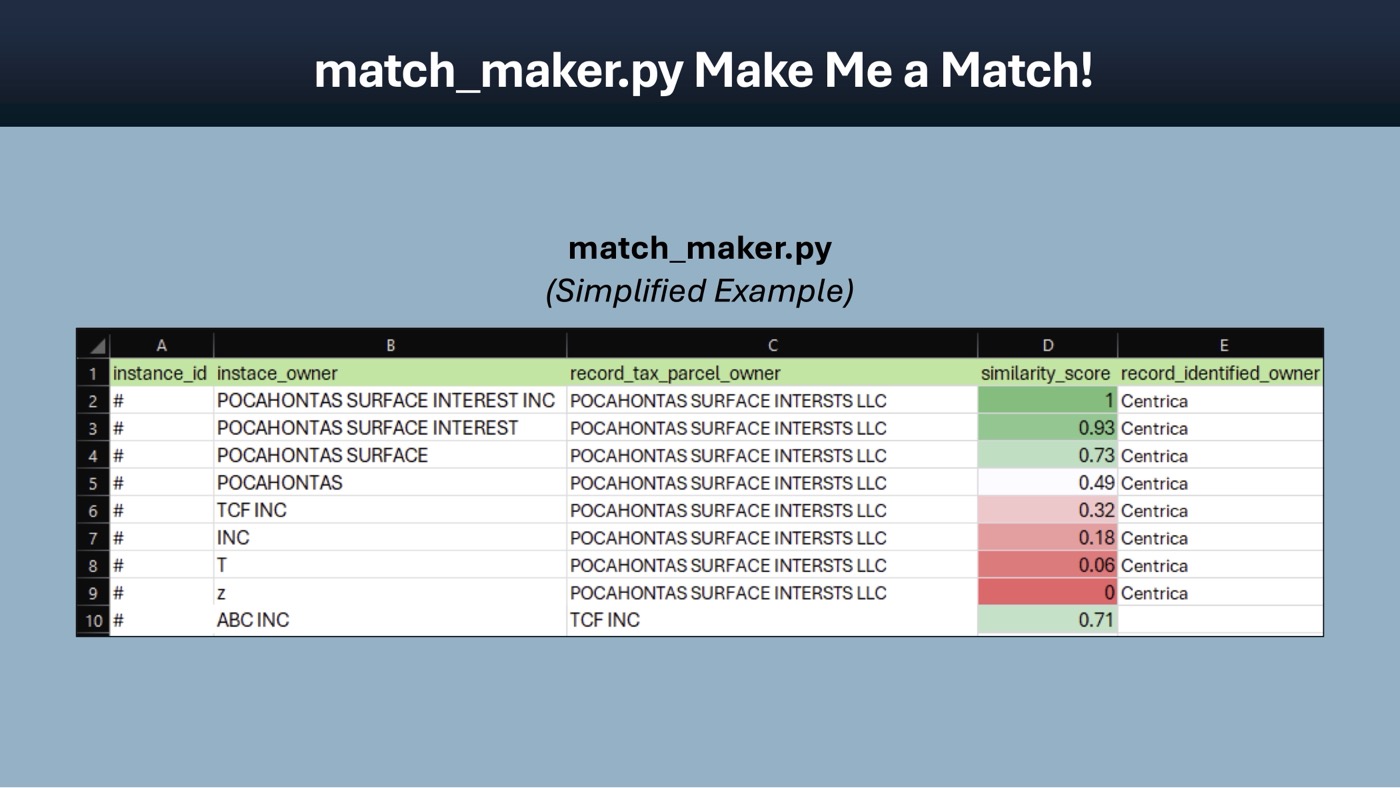
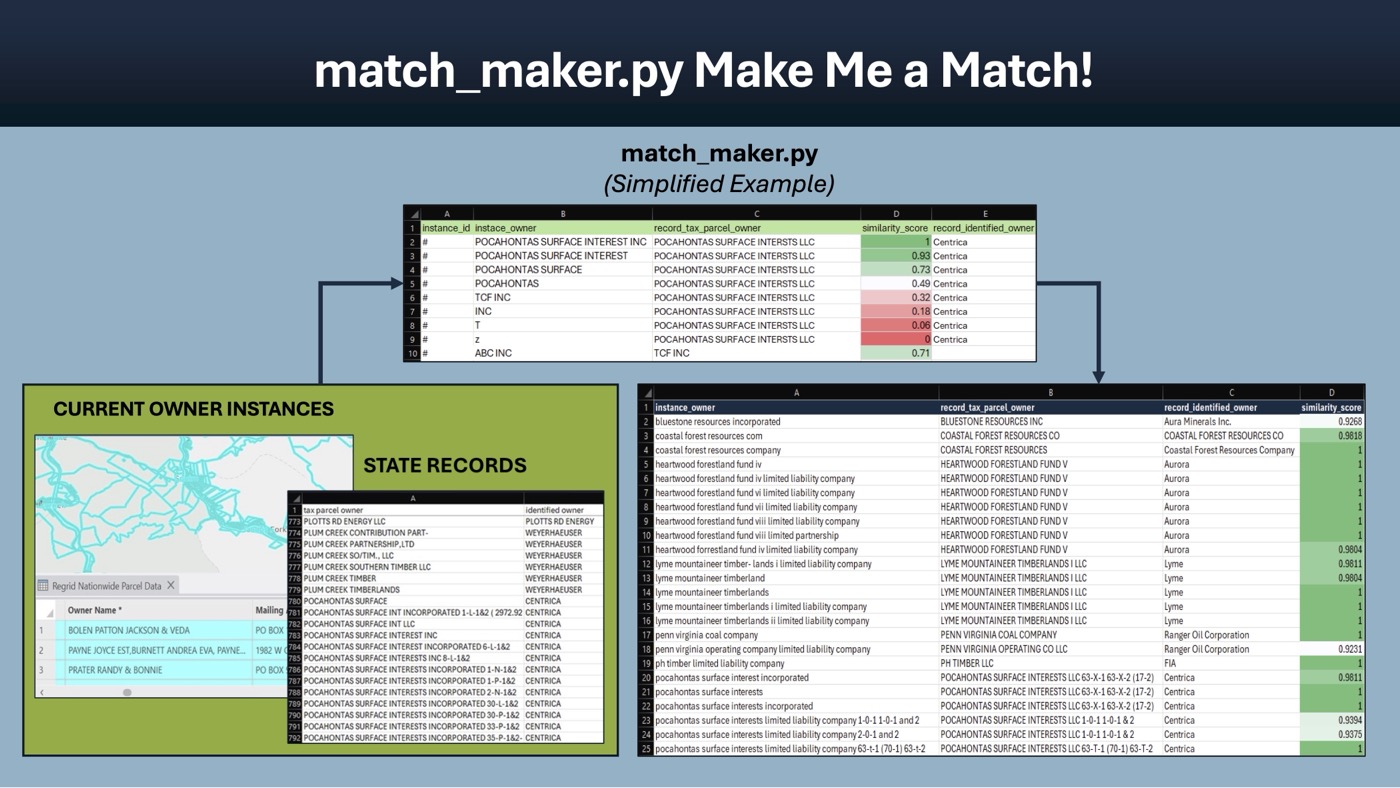
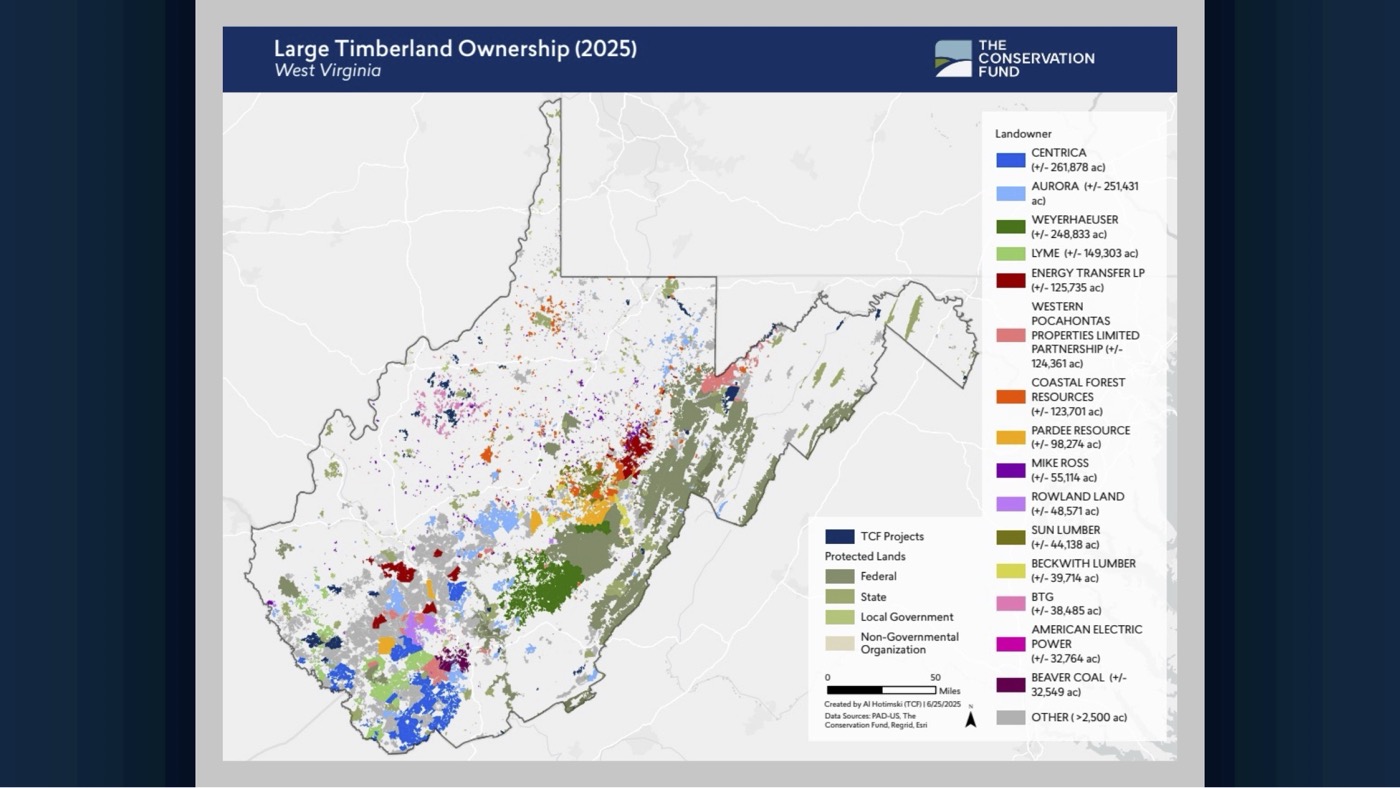
1. Entity Resolution: I built a relational database capturing recorded child-LLC-to-parent-LLC relationships, then developed a custom Python package (matchmaker) that uses fuzzy string matching to reconcile inconsistent owner name instances against known child LLCs in the records database. Performance-critical components were implemented using C-based Python libraries to ensure the system scales efficiently across large datasets. After automated matching, a manual verification step confirms assignments before they are written to the ownership layer. The output is a feature class where every tax parcel is attributed to its resolved parent owner, providing a transparent, accurate representation of true ownership across the landscape.
Data source note: the corporate family database is built from official public LLC filings. This system is architected to integrate with a corporate family API (e.g. OpenCorporates) if one becomes available, but runs fully on a local relational database in its current form.
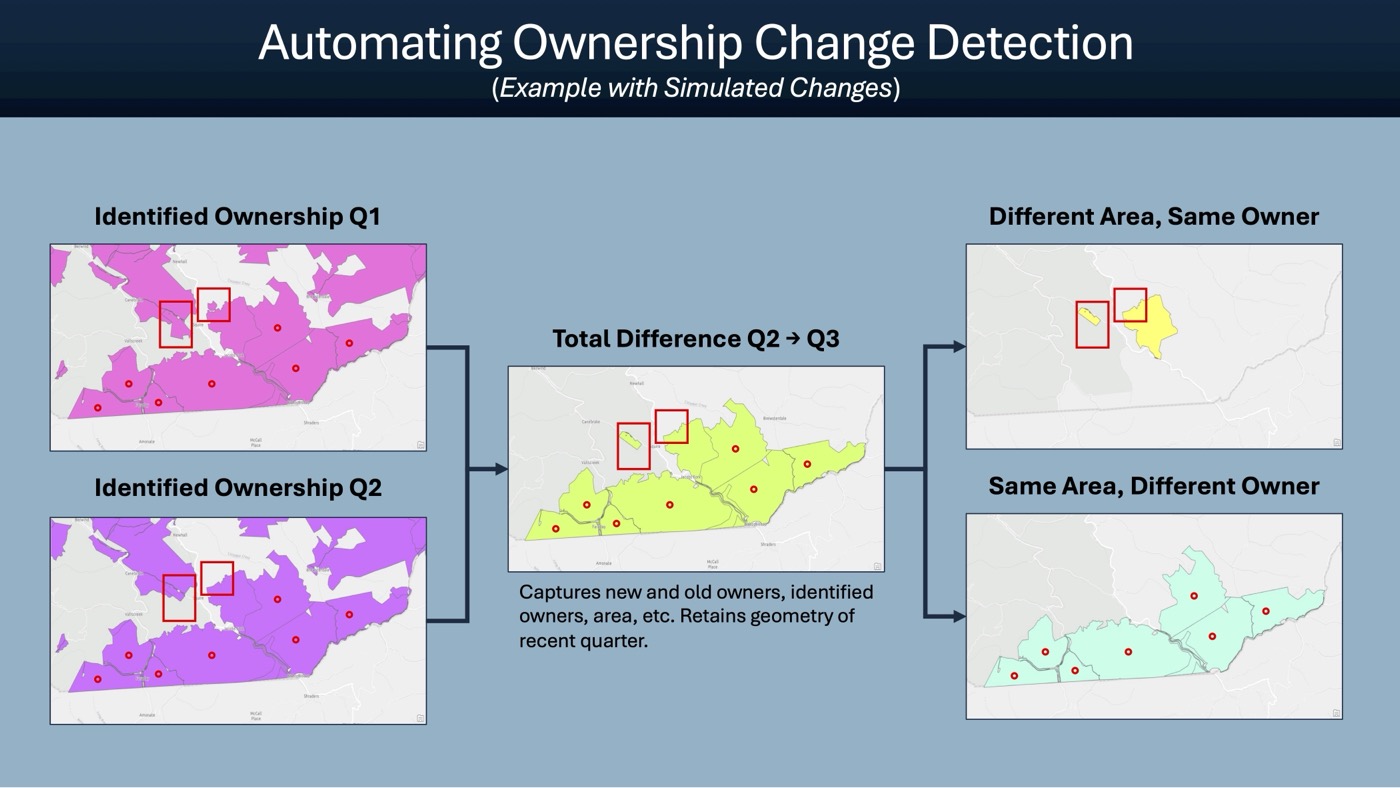
2. Temporal Differencing: Two parent ownership layers from different time periods are compared using spatial overlay analysis: polygon intersections, negative intersections (erase/difference operations), and symmetric difference to isolate parcels where ownership attributes or geometries diverged between snapshots. An area threshold filter removes trivially small geometry differences caused by survey corrections or coordinate precision artifacts, ensuring only meaningful boundary changes, including partial sell-offs, are flagged. Topology validity is ensured upstream by using ReGrid’s standardized, pre-validated parcel geometries as input, eliminating the need for geometry repair as a processing step.
3. Change Classification: The full logical space of parcel-to-parcel comparisons produces four scenarios. Three represent meaningful change and are retained as output; the fourth is filtered out as a true negative:
- Different owner, same boundary
- Different owner, different boundary (including partial sell-offs)
- Same owner, different boundary
- Same owner, same boundary (no change, filtered out)
Versioning: Each state maintains its own geodatabase with date-stamped feature class layers from every pipeline run. The schema is consistent across all runs, enabling programmatic comparison without manual alignment. This creates a queryable archive that supports point-in-time reconstruction of the ownership landscape (the system can answer “who owned this parcel on this date” from the historical record) as well as longitudinal trend analysis across any time window covered by the snapshots.
Analytical Value: The change output supports a range of conservation and land intelligence use cases:
- Habitat fragmentation detection - identifying trends where large contiguous blocks are being subdivided and sold off in smaller patches
- Parcelization rate analysis - tracking how quickly forest tracts are being split over time in a given region
- Ownership consolidation and divestment monitoring - detecting when a single entity is quietly assembling adjacent parcels, or systematically liquidating holdings
- Transfer velocity - measuring how frequently parcels in sensitive areas change hands, a leading indicator of development pressure
- Industrial-to-private conversion - flagging when corporate timberland transfers to residential developers or extractive operators
- Conservation targeting - identifying parcels adjacent to protected lands that are at elevated risk, and prioritizing easement outreach accordingly
ACEP Easement Eligibility Screening Tool
Tools: Python (arcpy) · ArcGIS Pro · ReGrid · USDA SSURGO · USDA NLCD · REST APIs
Source code is internal to The Conservation Fund. The pipeline architecture, the WorkingFarmsFund.pyt toolbox structure, the sequential SSURGO and NLCD raster filters, and the checkpoint/resume design are described in detail below. Sanitized screenshots and a workflow diagram are included. Walkthrough or code review available on request.
Problem: Identifying which farm parcels qualify for USDA NRCS ACEP (Agricultural Conservation Easement Program) grants requires cross-referencing soil classification and land cover data against program eligibility thresholds: a process that previously required manual Web Soil Survey queries county by county, taking 20+ analyst hours per screening run.
What I Built:
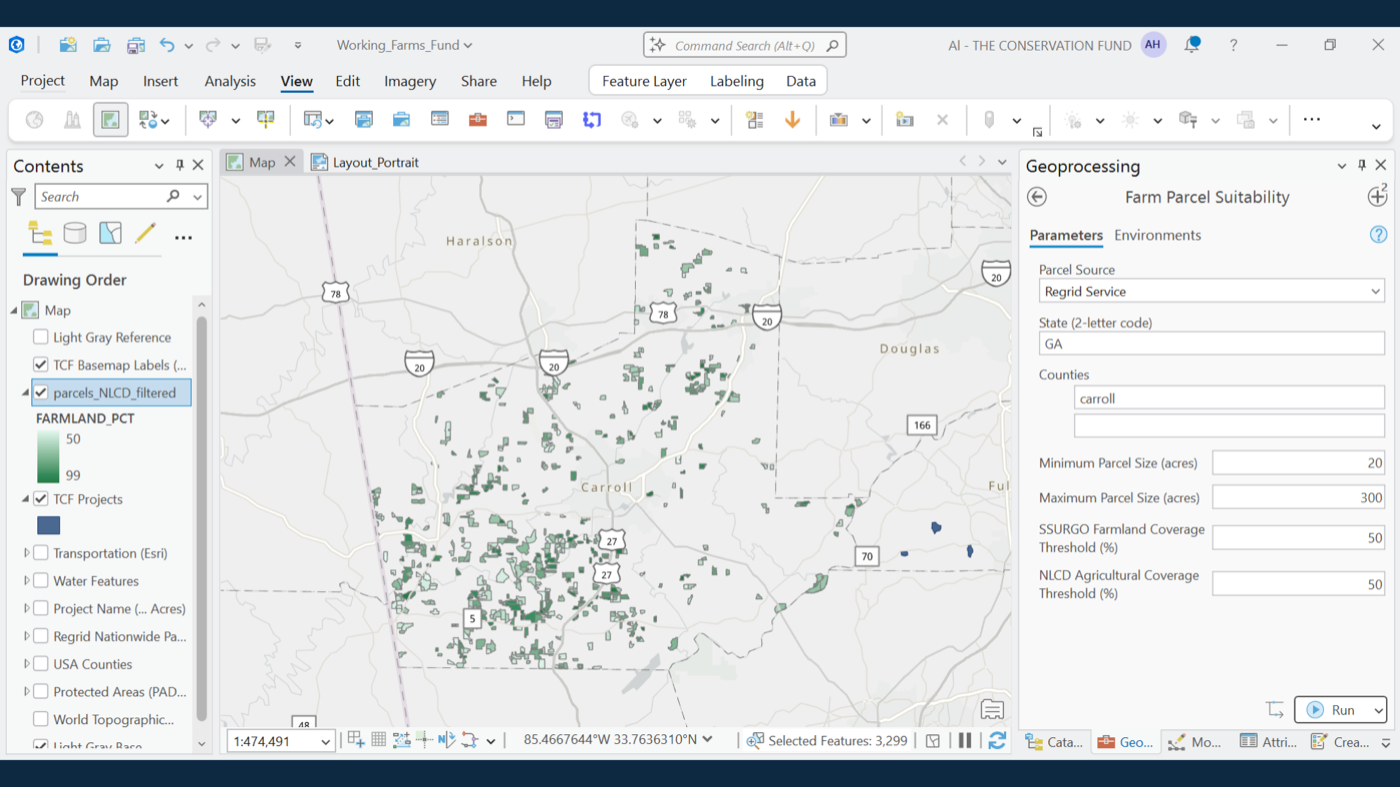
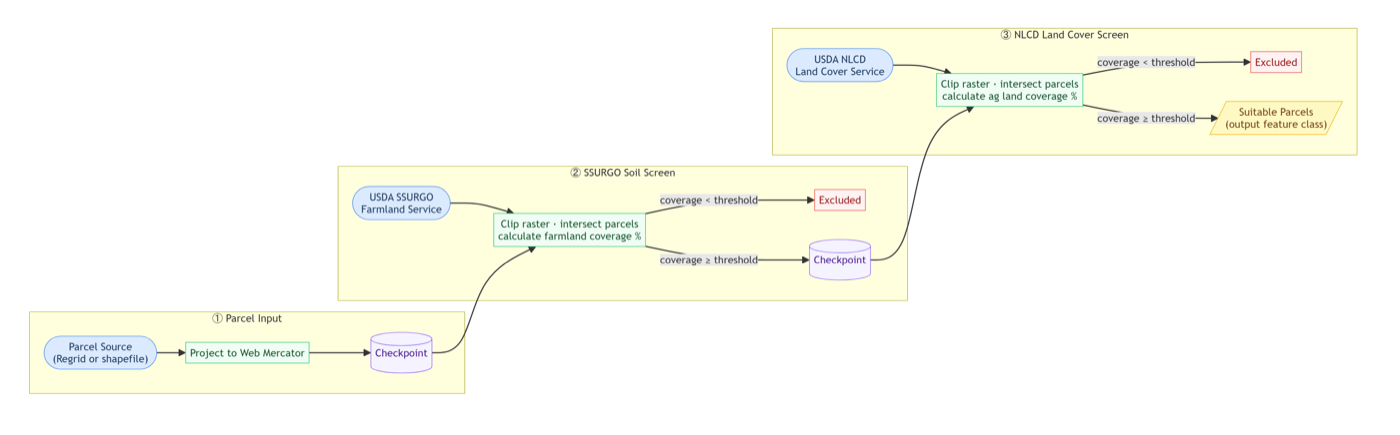
An ArcGIS Pro Python toolbox (WorkingFarmsFund.pyt) that automates regional parcel screening for ACEP eligibility at scale. The pipeline runs two sequential raster filters against live USDA map services, with configurable thresholds and checkpoint saving so interrupted runs resume from the last completed stage rather than starting over.
1. SSURGO Soil Screen: clips the USDA SSURGO farmland classification raster to each parcel and calculates the percentage of prime farmland and statewide-importance farmland coverage. Parcels below the configured threshold are excluded.
2. NLCD Land Cover Screen: clips the USDA National Land Cover Database raster and calculates agricultural land coverage (pasture, crops, grassland) per parcel. Parcels below the ag land threshold are excluded.
The output feature class includes per-parcel acreage and percentage breakdowns for every SSURGO and NLCD category, giving field staff the data needed to prioritize landowner outreach without any manual GIS work.
Parcel input is flexible: the tool accepts a ReGrid REST feature service, a local shapefile, or any feature class, and auto-detects state and county fields when a ReGrid layer is present.
Pipeline diagram:
Outcomes:
- Analysis time: 20+ hours → 10 minutes
- Projected $12,000/year in analyst time savings at monthly execution cadence
- Replaced manual Web Soil Survey workflows with a single parameterized tool run
- Enabled faster, evidence-based response to landowner inquiries and grant cycles
Future Work:
- Post-screening enrichment via the USDA Soil Data Access (SDA) API to append richer tabular soil attributes (NCCPI productivity scores, land capability class, drainage class, erodibility) directly to the output feature class
- Raster-layer-agnostic architecture to support other screening programs beyond ACEP
- QGIS-compatible implementation to remove the ArcGIS Pro license dependency for land trusts and partner organizations that use open-source GIS
Urban Growth in Fire Hazard Severity Zones, LA County
MS Capstone Project · CAS EE 644 · Boston University · Spring 2025
Tools: Google Earth Engine · Landsat 5 / Landsat 8 · Random Forest · CAL FIRE FHSZ · ArcGIS Pro
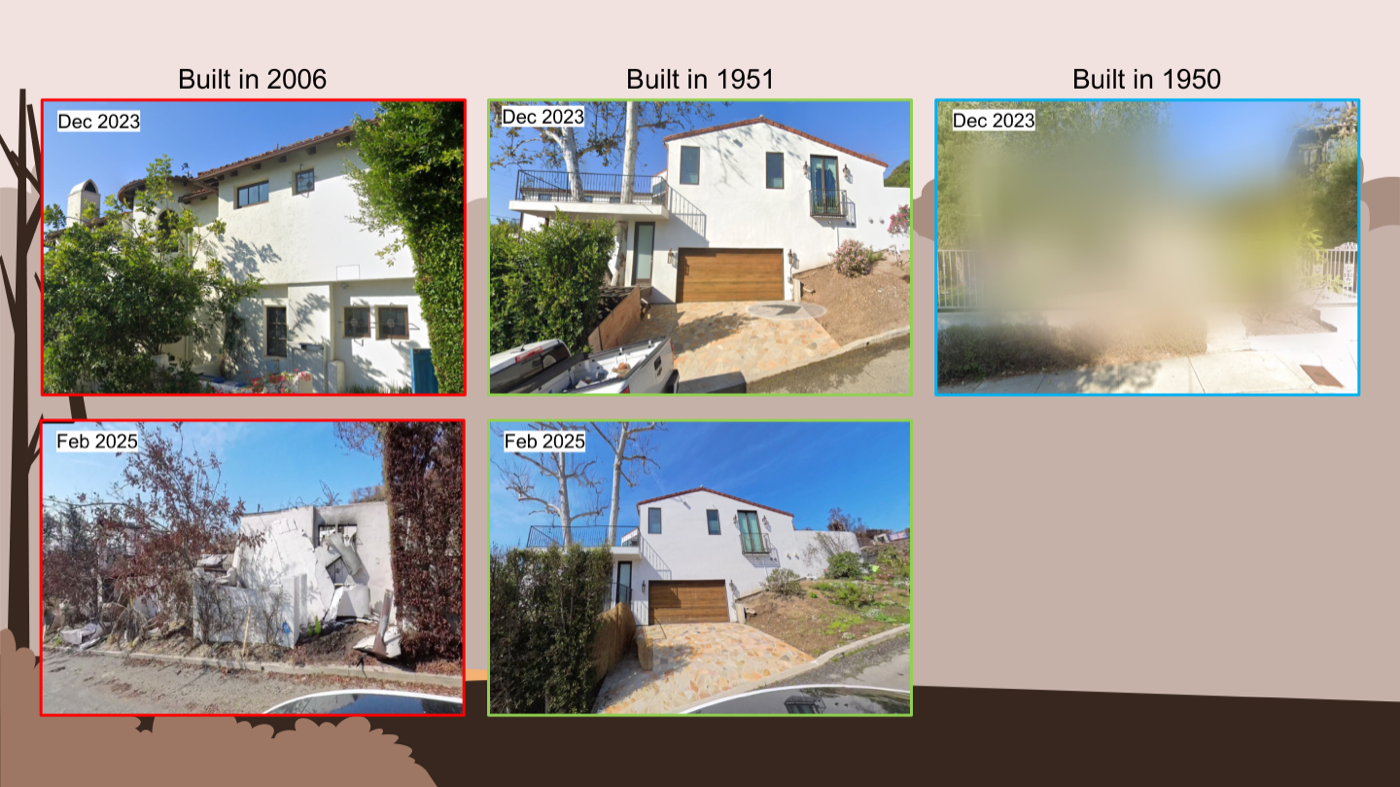
Key Finding: 16,643 hectares of new development were detected within LA County’s very high fire hazard zones between 2007 and 2024. The majority of it predates the hazard designations meant to restrict it, exposing a structural gap between land cover change and regulatory response.
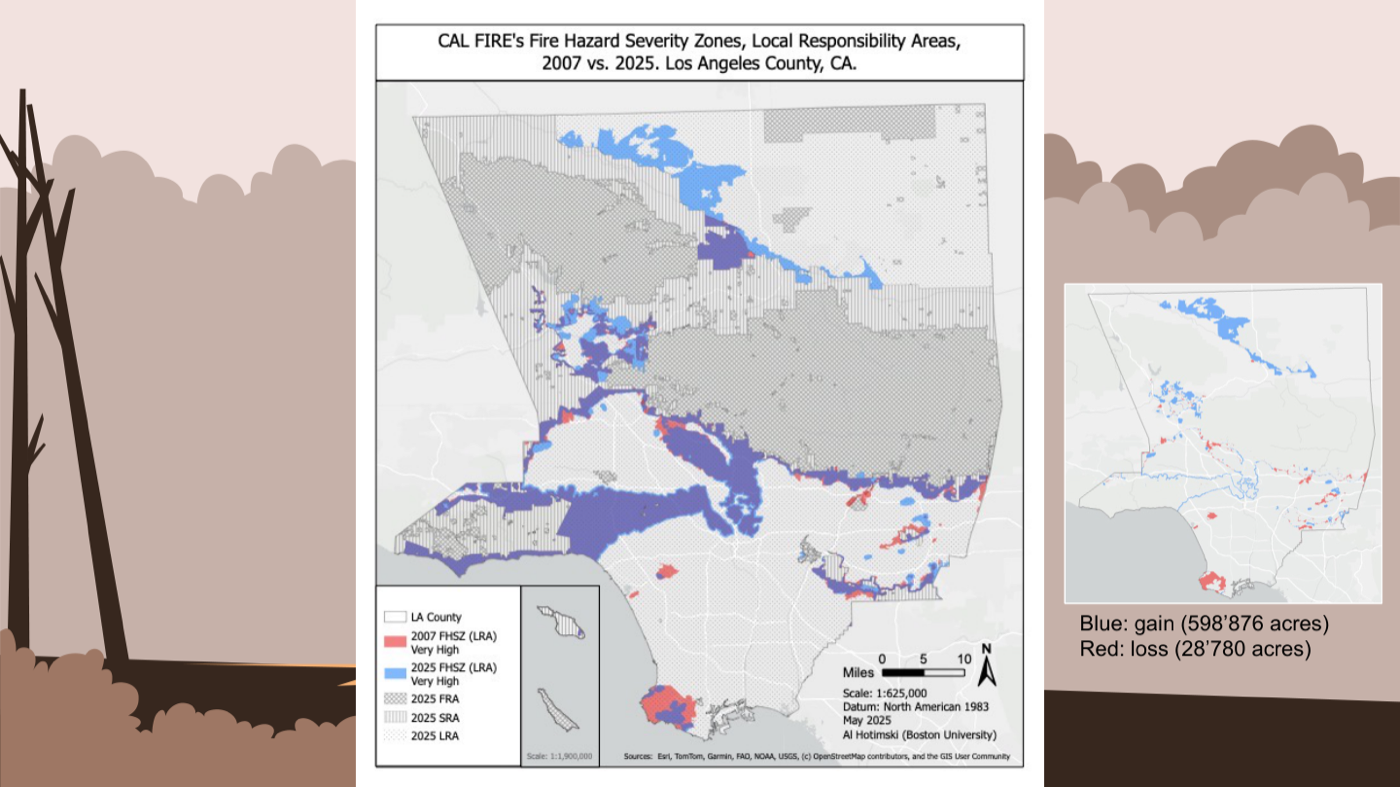
Context: In early 2025, CAL FIRE released the first comprehensive update to its Local Responsibility Area (LRA) Fire Hazard Severity Zone (FHSZ) maps since 2011, a roughly 14-year gap during which wildfire frequency and severity rose dramatically. The 2025 Eaton Fire and the 2017 Tubbs Fire both occurred in areas the 2007 maps underestimated. This project was designed to characterize what land cover change actually happened inside those very high hazard zones during the years the maps went unchanged.
Study Area: The union of the 2007 and 2025 CAL FIRE LRA “Very High” FHSZ boundaries in Los Angeles County (9.6 million residents, the most populous U.S. county). Total study area: 168,490 hectares.
Methodology:
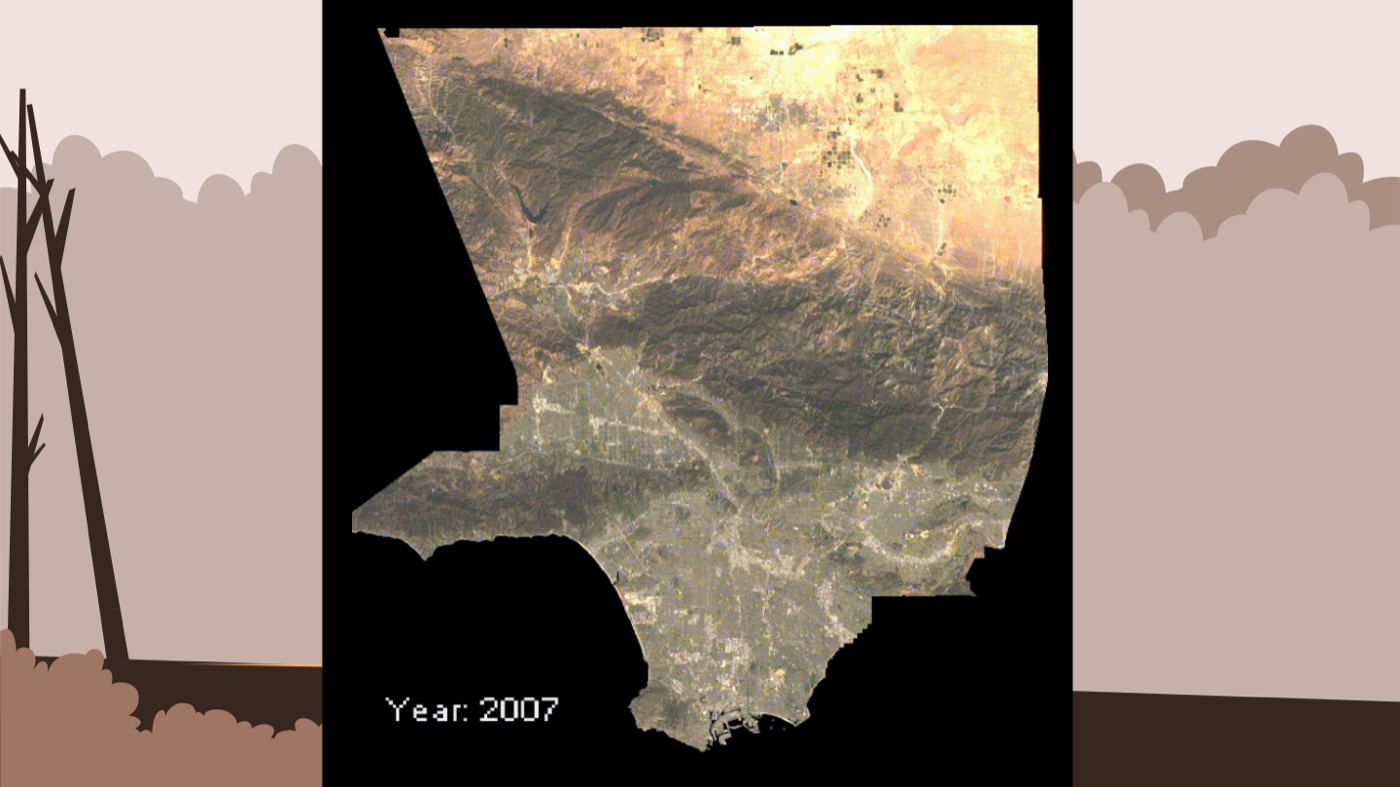
Imagery and Compositing: Landsat 5 imagery (2007) and Landsat 8 imagery (2024) were accessed via Google Earth Engine. Each sensor produced a year-long annual composite incorporating cloud and cloud shadow masking, quality pixel selection, and max-NDVI pixel selection to best represent vegetation type and seasonal variation.
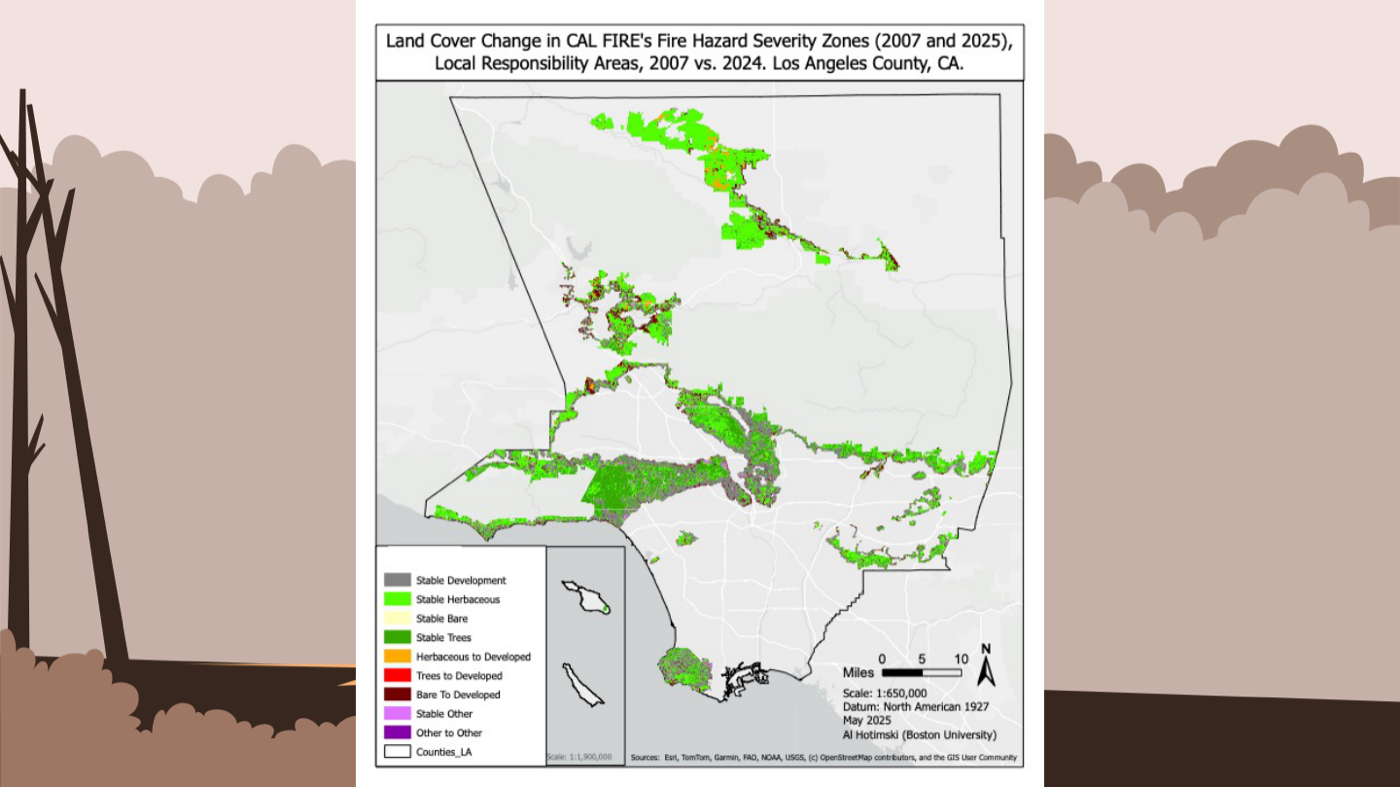
Classification Schema: A 9-class two-date change detection schema was designed to distinguish stable land cover from conversion to developed land, with three dedicated development conversion classes to isolate where and from what cover type new development occurred:
| Class | Description |
|---|---|
| Stable Developed | Urban, roads, high-density housing, suburbs, solar panels |
| Stable Herbaceous | Shrubbery, chaparral, previously burnt areas |
| Stable Tree | Dense vegetation, trees, previously burnt areas |
| Stable Bare | Desert, sand, development lots, mining, landfills |
| Herbaceous to Developed | New development from herbaceous cover |
| Tree to Developed | New development from forested cover |
| Bare to Developed | New development from bare/graded land |
| Stable Other | Water, reservoirs, golf courses, crop fields, snow |
| Other to Other | Uncategorized change: vegetation loss, reservoir fill/drain, riverbanks |
Model: Random Forest classifier (200 decision trees), trained on reference data collected in Google Earth Engine. Accuracy assessed using stratified random sampling, weighted confusion matrices, area estimates, and uncertainty quantification (standard error per class).
Key Findings:
- 16,643 hectares of new development detected within the very high FHSZ study area (area SE: 2,718 ha)
- Largest new development class: Bare to Developed (12,038 ha), predominantly neighborhood construction approved before the 2007 FHSZ maps were enacted
- Herbaceous to Developed was the second largest conversion class, capturing post-2007 approved construction and, near Lancaster, large-scale solar panel infrastructure installation
- Stable Developed totaled 43,907 hectares, with the highest joint Producer’s and User’s accuracy of any class
- The 2025 FHSZ update expanded very high zones significantly around Santa Clarita, where new neighborhood development was also highest, illustrating how development and hazard designation have tracked together
- Rolling Hills (southern LA County) showed the largest FHSZ loss between maps: the 2025 update reclassified its established developed areas downward, likely to high rather than zero hazard
Key Takeaway: Communities now living in very high fire hazard zones were largely developed before the hazard designation existed or was enforced. The lag between land cover change and official hazard zoning creates a structural gap in municipal planning and insurance regulation that cannot be resolved by map updates alone.